DLL Export Viewer Tools
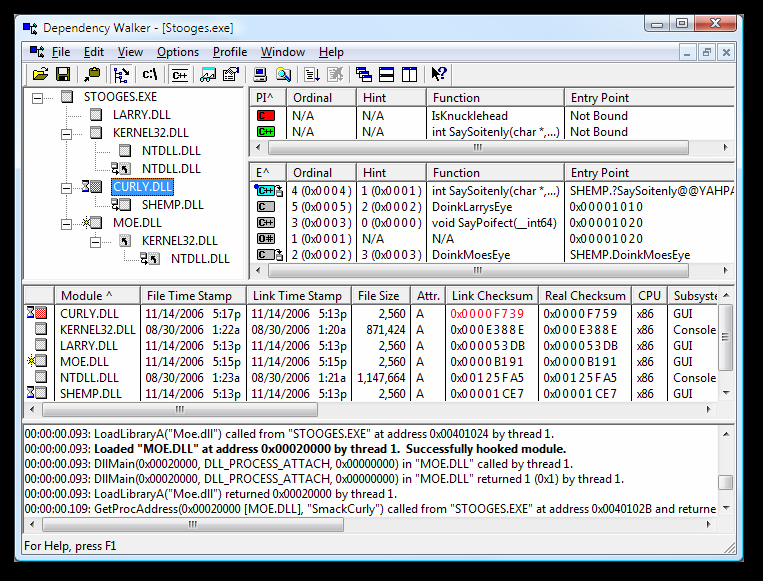
在使用 C/C++ 开发中,遇到 动态链接库则需要查看导出的方法名,在 WinXP 年代,大家都使用 dependency walker 工具,简单好用。后来到Win7 之后,这个工具就没有再更新了,使用起来不那么顺手了,需要新的工具。
1. dependency walker
Dependency Walker is a free utility that scans any 32-bit or 64-bit Windows module (exe, dll, ocx, sys, etc.) and builds a hierarchical tree diagram of all dependent modules. For each module found, it lists all the functions that are exported by that module, and which of those functions are actually being called by other modules. Another view displays the minimum set of required files, along with detailed information about each file including a full path to the file, base address, version numbers, machine type, debug information, and more.

2. Dependencies
A rewrite of the old legacy software “depends.exe” in C# for Windows devs to troubleshoot dll load dependencies issues.

3. DLL Export Viewer
This utility displays the list of all exported functions and their virtual memory addresses for the specified DLL files. You can easily copy the memory address of the desired function, paste it into your debugger, and set a breakpoint for this memory address. When this function is called, the debugger will stop in the beginning of this function.
For example: If you want to break each time that a message box is going to be displayed, simply put breakpoints on the memory addresses of message-box functions: MessageBoxA, MessageBoxExA, and MessageBoxIndirectA (or MessageBoxW, MessageBoxExW, and MessageBoxIndirectW in unicode based applications) When one of the message-box functions is called, your debugger should break in the entry point of that function, and then you can look at call stack and go backward into the code that initiated this API call.


